So the whole school wrote a few exams that I helped manage and implement, and now I have some whole school data. Now what? What do I do with the data that I've got?
First of all I have to thank all of the teachers that did the hard work of administering the exam to their students, grading and recording the results and getting the info into me in a timely and well organized fashion. I know these tests eat into the quickly disappearing classroom instructional time, and I truly appreciate the effort you take in these whole school projects.
As I am reading through the body of numbers that I have carefully compiled and analyzed , the dominant thought that keeps coming up is this, "look at all those flaws."
To begin, rather than jump right in and use the data that I do have, I want to refine the data collection process, so that next year there will be far fewer flaws, and far more effective, usable information. This approach of focusing on the negative, may in itself be flawed, but I will follow Stephen Covey's advice because, "the highest and best use of a person's time is that action that most effectively addresses the problems at hand and is most consistent with the individual's identified purpose in life."
My purpose: collect meaningful and useful data on the literacy and numeracy skill levels for the entire student population. This data must be openly shared with teachers so that they can have more information about their students and their instructional effectiveness. This knowledge can then be used to refine instructional practice.
 |
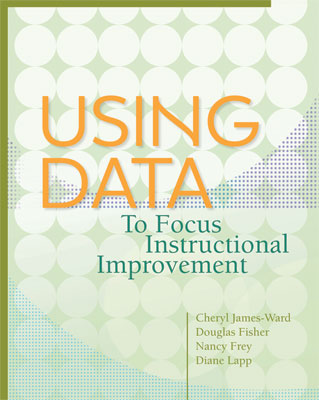
| I haven't read this book ;-) |
Now that I know my purpose I need to understand the problems at hand, so here they are:
Problem 1: The information on the outliers is not accurate enough. From this recent battery of assessment information I calculated that in grade 9 alone there are 29 students reading at a University level of reading comprehension. At the same time I calculated another percentage of students reporting similairly flawed results, but at the low end of the g.l.e. spectrum. While it is certainly clear that there is a range of ability, I know these students personally, and I know that both results are inherently flawed. The problem with this is that if a report of 12.9 grade level equivalent and a report of 2.2 g.l.e.is flawed, then doesn't it stand to reason that a report of 7.8 g.l.e. or a report of 9.4 g.l.e. is flawed as well?
Problem 2: Exam implementation. While the exam administration and implementation this May was astoundingly better operated than the one in September there are still some big gaps in how this assessment is handled. Two points of conflict arise i) some classrooms allowed students to use calculators while some did not ii) one of my key math teachers tells me the estimation exam is much less valuable than the computation exam ie) I may have been using the wrong assessment.
Problem 3: There may be enough information in the one reading comprehension exam. Does it make sense to include reading comprehension part two? Vocabulary? Spelling? Language/Writing Conventions? If so, then how could I ensure a smooth administration of a much more complex and harder to organize, grade and analyze battery of assessment?
The ultimate goal is how to use the data effectively, but until the above problems are addressed, the next step should really not be taken.
Solution 1: The test sequence needs to be changed. Instead of starting a Fall Grade Seven Exam at level 16. We have to start the testing sequence at level 15. The future test sequence needs to be as follows:
- Fall
- Grade 7 - Level 15
- Grade 8 - Level 16
- Grade 9 - Level 17
- Spring
- Grade 7 - Level 16
- Grade 8 - Level 17
- Grade 9 - Level 18
This eliminates the vastly flawed results from the grade nine level 19/20 exam. This will eliminate the top range outliers, but there is still a problem with our strategies and literacy students writing exams that yield the useless results of g.l.e 1 - 4. The solution that I propose for this problem will be to drop down one exam level for the strategies class and two exam levels for literacy classes. So when the regular grade eight class write a level 16 exam the strategies class will write a level 15, and when the regular grade 9 class writes a level 17 exam the literacy class will write a level 15. This should hopefully eliminate the inaccurate and useless low-level g.l.e. outliers.
Solution 2: Exam implementation and administration by classroom teachers. This problem can be solved in the same way as Solution 3 will be solved. I need to work with the teams on building next years battery of exams. I need to ask math which is the more beneficial exam (estimation, computation or both), and I need to work with the humanities team and find out which exams they would like me to run (r.c 1, r.c. 2, spelling, vocabulary, writing conventions or some combination of the 5 tests). Once this has been decided I can do the labour intensive first draft and keep a collection of originals for teachers to re-create.
Solution 4: I need two instructions to come across more clearly when we do this in September i) when can a calculator be used b) teachers need to instruct students on how to fill in a scantron - ever single time. It is surprising how many grade nine students used pen or crossed out instead of erasing their answers when they changed their minds.
 |
| The next step is the hard one. |
Now that the above problems have been addressed the real work will begin: How can we use the data effectively?
This may seem like a one part endeavour, but it is slightly more complex. There are two separate issues. One issue can be addressed here, and with the help of my staff, and the other step needs to be considered a future date, after the conversations with the humanities and math teams have taken place.
The step that we will not take today is how do we effectively use this data once it has been collected in September? Save that for a future date.
The step we are taking today is how do we use the data that we do have right now? I will start and I hope you can finish in the comment section below. We have whole school information about one standard reading comprehension exam and one numeracy exam. What do we do with this info?
- Use it to help place students in their classes next year. As we move to ability grouping for our classes next year this data can be the hard fact that help justify some movements. Of course the knowledge of our students as individuals will trump this numerical report, but this information can help inform some of the more difficult decisions.
- Look at our own personal effectiveness as a classroom teacher when compared to our peers. Is one class improving more? Why is that? Are there particular students in your class that experienced remarkable improvements? Can you think of anything in your instruction that would explain the phenomenon?
- What else???? comment below or email me steven.greene@epsb.ca
 |
| One more big question |
As I am writing the above numbered list about what to do with the data that we have there is one nagging question in the back of mind? Is this worth it? Will the data that is eventually arrived at really help our school reach their goal of better instruction and learning at higher levels?
I think yes, but I would like to talk about it and know for sure. What do you think?

.jpg)
.jpg)