This is a report that I created for the staff of Westlawn school. It is a foray into whole school assessment data to inform programming.
Preamble
All results in this report indicate only that students performed better on the specific AIMSweb standardized assessments. There is no, as yet, indication that this will be reflected in teacher assigned grades, PAT exams or other, more general, measures of literacy and numeracy.
What was tested
There were four standardized exams that we used three times this year. All data in this report is sourced from these four exams.
Math Applications MCAP
|
Test of applied mathematics. There is an element of literacy in these questions. Questions typically ask students to use grade level numeracy skills to solve problems of varying complexity.
|
Math Computation MCOMP
|
Test of automaticity, speed and ease of recall when solving basic numeracy questions. Conversions, algebra, exponents, etc… There are no literacy requirements to answer these questions.
|
Reading Curriculum Based Measurement RCBM
|
This timed reading probe assesses a student's fluency and oral reading speed. There is significant research which argues that a student’s ability to read out loud is a key indicator of a student’s overall literacy level.
|
Reading Maze
|
This reading comprehension test measures how well a student understands a passage that they read silently.
|
On Percentile Scoring
All information is reported in Percentile Scores as measured against approximately 8000 Aimsweb students from the same grade level. Keep this in mind when interpreting scores. If a student is in the 50th %ile in September and they remain in the 50th %ile in June they have experienced the typical growth that should be expected. No change in %ile score indicates the growth experienced by that students peers. If the student experienced a 5%ile score increase, as reported in the attached spreadsheet that would indicate the student experienced typical growth in literacy or numeracy plus a rate of growth 5% higher when compared to peers.
No change in %ile score = regular and steady growth relative to peers.
|
Impact of Learning Strategies Options
Students in the numeracy learning strategies class (taught by Mr. Makowsky) showed the most significant improvement in their numeracy scores. There has been outstanding growth (45.5 %ile increase) on the MCOMP assessment, and there has been significant growth (27.5 %ile increase) on the MCAP assessment. This growth far outperforms the growth of the whole school population (4.3 %ile increase, 3.5 %ile increase respectively). Data was drawn from students in the two grade 8/9 option classes in semester two.
%ile Change Measured in June Compared to Fall Score
M-CAP
|
M-COMP
| |
Whole School
|
+ 3.5
|
+ 4.3
|
Learning Strategies Option Numeracy
|
+ 27.5
|
+ 45.5
|
Students in the literacy learning strategies class (taught by Mr. Greene) show some improvement in their literacy scores. There was significant growth (12.1 %ile increase) on the R-Maze assessment, but there was not a significant improvement on the RCBM assessment (5.1 %ile increase). This growth marginally outperforms the growth of the whole school population (3.1 %ile increase, 2.9 %ile increase respectively). Data was drawn from students in the two grade 8/9 option classes in semester two plus students in the grade seven option class from semester two.
%ile Change Measured in June Compared to Fall Score
R-CBM
|
R-Maze
| |
Whole School
|
+ 2.9
|
+ 3.1
|
Learning Strategies Option Literacy
|
+ 5.1
|
+ 12.1
|
See Appendix One - Learning Strategies Option/Whole School Comparison
Implications for Next Year
We must continue the learning strategies numeracy class with as little alteration to it as possible. Mr. Makowsky’s program of instruction, general pedagogical technique and specific lesson plans deserve to be recorded, documented and duplicated where possible. Implications of his instruction on other larger scale assessments should also be analyzed and discussed by the math team.
Key Finding: Mr. Makoswky has developed a highly effective math intervention program.
|
Learning Strategies Literacy should also continue, but the focus of instruction should be altered. There needs to be continued standardized assessment of student reading comprehension levels. Too many new techniques should be avoided. It would be advisable to develop a specific program for instruction, document the approach and analyze results at the end of term one to see if there are significant improvement to student reading comprehension. Any study of this intervention, however, would require whole school data in order to have a comparative group of students (we need a control group).
Impact of Homeroom Groupings.
We have called them homogenized, streamed and stratified, but whatever we decide to call them the data from AIMSweb assessments indicate that they do not work for all student levels. Surprisingly it turns out that the biggest impact has been for the lower level classes on their M-COMP performance (11.6 %ile increase). On the same test the higher level classes suffered a negative performance (3.6 %ile decrease). The middle group had a marginal increase in performance on the M-COMP (4.5 %ile increase). The M-CAP exam is worth mentioning as well because only the middle group had significant growth (9.2 %ile increase) while the lower and higher groups remained statistically unchanged (2.2 %ile increase, 0.9 %ile decrease respectively). There was no impact on the R-CBM or R-MAZE that is worth reporting. Data was drawn by grouping the 7-1, 8-2, 9-1 as the low group, 7-2, 8-1, 9-2 as the middle group and 7-3, 8-3, 9-3 as the high group. Keep in mind that the High Group scores were quite high in September(see graphs in appendix two), and that we moved high performing students from the low to the middle group and from the middle to the high group.
%ile Change Measured in June Compared to Fall Score
RCBM
|
RMAZE
|
MCAP
|
MCOMP
| |
Whole School
|
+ 2.9
|
+ 3.1
|
+ 3.5
|
+ 4.3
|
Low Classes
|
+ 3.2
|
+ 3.1
|
+ 2.2
|
+ 11.6
|
Middle Classes
|
+ 2.3
|
+ 4.6
|
+ 9.2
|
+ 4.5
|
High Classes
|
+ 3.1
|
+ 1.6
|
- 0.09
|
- 3.1
|
See Appendix - Two Homeroom Grouping Comparisons
Implications for Next Year
There is no impact of this years homeroom groupings on these measures of literacy and numeracy. In the interest of studying the impact of homeroom groupings I would argue that next year we attempt full inclusion, heterogeneous groupings with an equal mix of high performing and low performing students in each class. We should then keep accurate measurements to see if this grouping of students impacts student performance on basic literacy and numeracy assessments.
My Point of View: based on the results of this year and using the same logic that led to homogenous groupings ie) let’s try it and see, I recommend that we eliminate the learning strategies homeroom classes and adopt a model of full inclusion.
|
Assessment Plan for Next Year
We ought to keep the M-COMP measurement because it is easy to implement and measure. The math team has also suggested that we go back to using the CAT exam, but we would have to purchase the CAT IV.
The one on one RCBM assessment should be kept because it provides the most accurate picture of a student's reading ability, but it should be administered by the language arts teachers so that they experience the first hand knowledge that this test has to offer.
There is one more key finding that is difficult to pull out of the data, but that I can offer up based on my experience having every student read to me and then discussing their results with them. In the June exam after every student heard their RCBM score (and found out whether or not it had changed significantly since the fall), I asked them why they thought they got the results that they did. Indeed some students had remarkable growth, so I asked them to explain themselves. One common finding came up again, again and again.
Key Finding: Students that were reading on their own time, for enjoyment, had remarkable and significant growth on the RCBM assessment. This finding was universal, regardless of the students initial score on the September assessment.
|
The implication of this second key finding is that our literacy intervention plan should be built around the idea of increasing students authentic love of reading. For some, extrinsic rewards can help pull students out of their literacy deficit, but for most simply making the love of reading an often talked about value that is part of our school culture and assessment practice will be enough to increase literacy scores. Of course how to accurately track and record this will take additional research on which standardized literacy measures are better than AIMSweb.
Appendix One Learning Strategies Option/Whole School Comparison
These Graphs represent real %ile scores over time, not change in %ile score over time. 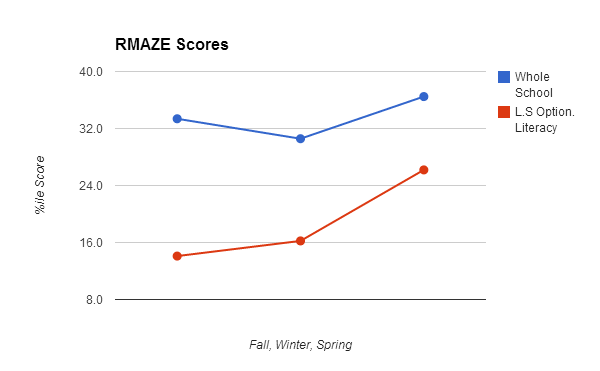


Appendix Two Homeroom Grouping Comparisons
These Graphs represent real %ile scores over time, not change in %ile score over time.


